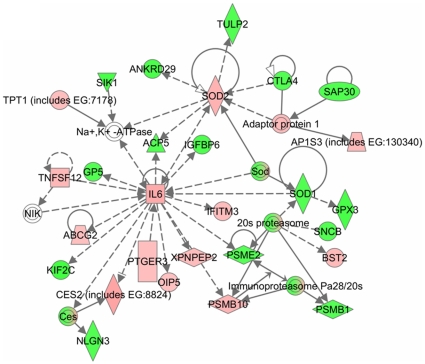
Figure 9. Network of genes involved in neurological disease and organismal injury in TNF-treated myotubes.
The gene network presented here was adopted from Ingenuity pathway analysis tool with differentially regulated genes by TNF-α with p-values ≤0.05 and ≥1.2-fold. The solid lines connecting molecules here represent a direct relation and dotted lines an indirect relation. The genes shown in red are up-regulated whereas down-regulated genes are shown in green color.

