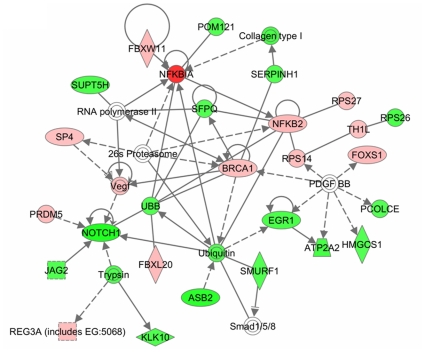
Figure 10. TNF-α regulates gene networks involved in nervous system development, cell cycle and cancer.
Schematic representation of gene network obtained from Ingenuity pathway analysis tool with differentially regulated genes by TNF-α with p-values ≤0.05 and ≥1.2-fold. The solid lines connecting molecules here represent a direct relation and dotted lines are representation of an indirect relation. The genes shown in red color boxes are those which are up-regulated whereas down-regulated genes are shown in green color boxes.

