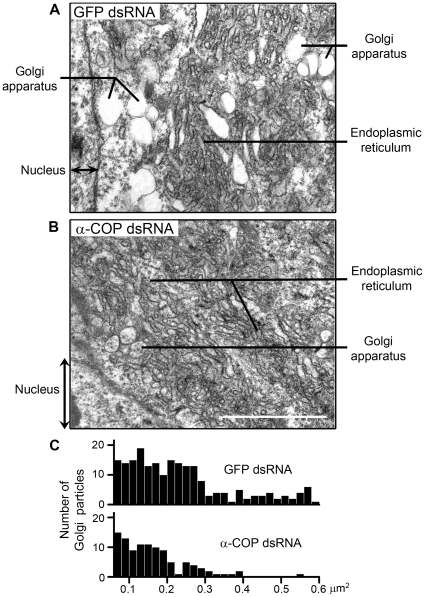
Figure 8. Detailed subcellular structures of COPI-deficient PSG.
(A) A representative electron micrograph of PSGs from GFP dsRNA-injected silkworms. (B) A representative electron micrograph of PSGs from α-COP dsRNA-injected silkworms. Scale bars represent 500 nm. (C) Statistic graphs of number (Y coordinate) and area (X coordinate) of Golgi particles in GFP/α-COP dsRNA-injected silkworms, according to the electron micrographs.

