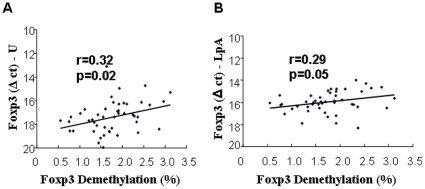
Figure 2. Correlation between demethylation of FOXP3 and unstimulated and LpA-activated FOXP3 mRNA expression.
Demethylation (%) of FOXP3 in whole cord blood was measured with real-time PCR. FOXP3 mRNA expression was measured with real-time RT-PCR in unstimulated (A) and LpA-stimulated CBMCs (B), which were shown as delta ct to 18S. Lower delta ct represents higher mRNA expression. N = 48; correlation was analyzed with Pearsons correlation coefficient.

