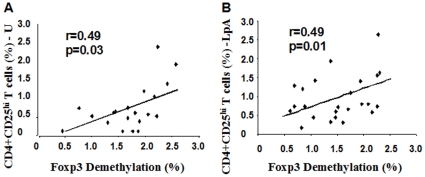
Figure 4. Correlation between demethylation of FOXP3 and CD4+CD25hi T-cells (%).
Demethylation (%) of FOXP3 was measured with real-time PCR. CD4+CD25hi T-cells (% in lymphocytes) were measured with flow cytometry. A. Correlation between FOXP3 demethylation and unstimulated CD4+CD25hi T-cells (%). B. Correlation between FOXP3 demethylation and LpA-activated CD4+CD25hi T-cells (%). N = 20/24; correlation was analyzed with Pearsons correlation coefficient.

