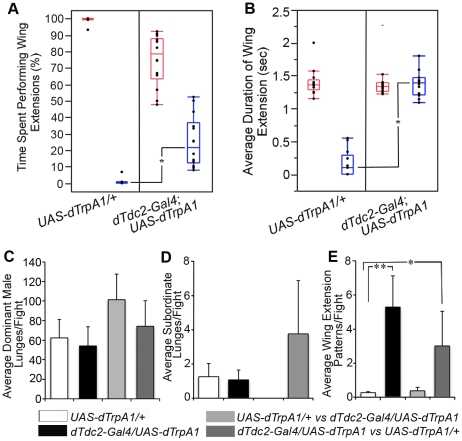
Figure 1. OA-neuron activated males display significant male-male courtship in competitive courtship and aggression assays.
(A) We quantified the total time a male performed wing extensions to a female or second male during a 10 min interval in the competitive courtship assay. The box plot depicts the percentage of total time spent performing wing extensions to females (red) and males (blue). The upper and lower edges of each box correspond to the 25% and 75% quantiles. The median (50% quantile) is shown as a horizontal line in each box and the lines depict the 5% and 95% quantiles. Asterisks show medians that are statistically different according to Wilcoxon rank sum for nonparametric data: UAS-dTrpA1/+− dTdc2-Gal4/UAS-dTrpA1 (P<.0001). Seven assays were performed with the Tdc2-Gal4/UAS-dTrpA1(III) and seven assays with the dTdc2-Gal4#1(new insertion)/UAS-dTrpA1(II) males (n = 14). Results were not statistically different and the data were pooled. (B) Box plot of the wing extension duration (in seconds) displayed by one male to a second fly (females indicated in red, males indicated in blue). The data were calculated by dividing the total wing extension time by the number of bouts for each male. The duration of the male-male wing extension by UAS-dTrpA1/+control males (n = 15) is significantly shorter than male-female wing extensions performed by the same males (Student's t test, P<.0001) and male-male wing extensions performed by dTdc2-Gal4/UAS-dTrpA1 males (asterisks: Student's t test, P<.0001) (n = 14). The wing extension duration data were collected from the competitive courtship assays described above. (C) The graph depicts the average number of lunges the dominant male in a pairing performed per fight. There are no significant differences between controls or OA-neuron activated males in the various pairings tested. (ANOVA for independent groups, P<0.4). Data from the individual columns represents distinct pairings; the white column = two UAS-dTrpA1/+ control males (n = 16), the black column = two dTdc2-Gal4/UAS-dTrpA1 males (n = 17), the light gray column = one UAS-dTrpA1/+ male and one dTdc2-Gal4/UAS-dTrpA1 male with the UAS-dTrpA1/+ fly emerging as the dominant male (n = 11/15 pairings), and the dark gray column = one UAS-dTrpA1/+ male and one dTdc2-Gal4/UAS-dTrpA1 male with the dTdc2-Gal4/UAS-dTrpA1 fly establishing dominancy (n = 4/15 pairings). (D) The average number of lunges the ultimate subordinate male performs per fight is depicted in this graph. There are no significant differences between control males or OA-neuron activated males in the tested pairings (ANOVA for independent groups, P<0.16). (E) OA-neuron activated males display courtship patterns toward a second male in aggression contexts. The average number of wing extensions per fight is significantly higher in dTdc2-Gal4/UAS-dTrpA1 male pairings than controls. (A negative binomial model (with log link function) was utilized. A likelihood ratio test of the equality of the group means yielded a highly statistically significant result (P<0.00001). Comparisons of groups yielded statistically significant differences between dTdc2-Gal4/UAS-dTrpA1 male pairings and control UAS-dTrpA1/+ males (Bonferroni-adjusted P = 0.00014) and between the dark gray column (one UAS-dTrpA1/+ male and one dTdc2-Gal4/UAS-dTrpA1 male with the dTdc2-Gal4/UAS-dTrpA1 fly establishing dominancy) and control UAS-dTrpA1/+ males (white column) (P = 0.0054)).

