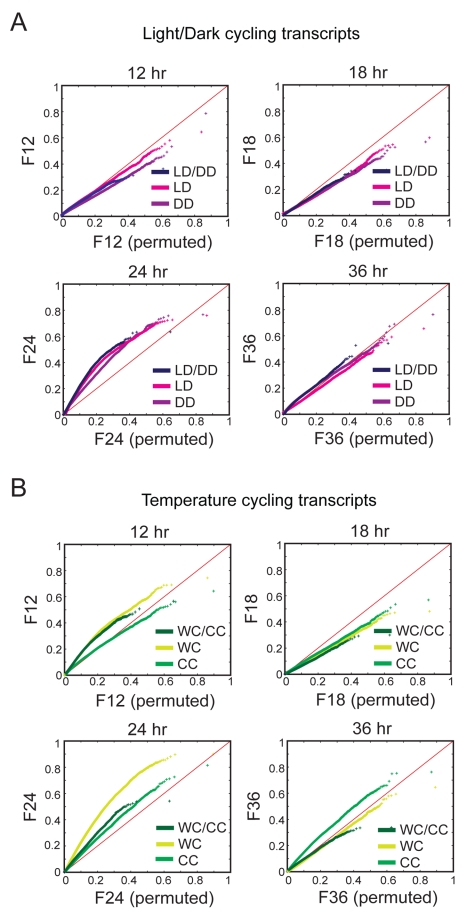
Figure 4. 24-h rhythms are enriched in the light- and temperature-entrained datasets.
QQ plots of Fourier scores at four different periods (12, 18, 24, and 36 h) are shown from LD-entrained (A) and temperature-entrained (B) datasets subdivided into categories as indicated in Figures 2 and 3. The Fourier scores of each transcript (with log2-transformed expression value >10) are graphed against the randomly permuted 95th quantile Fourier scores. Enrichment of the experimental period is shown as an upward departure from the diagonal (red line), while depletion is shown as a downward departure.

