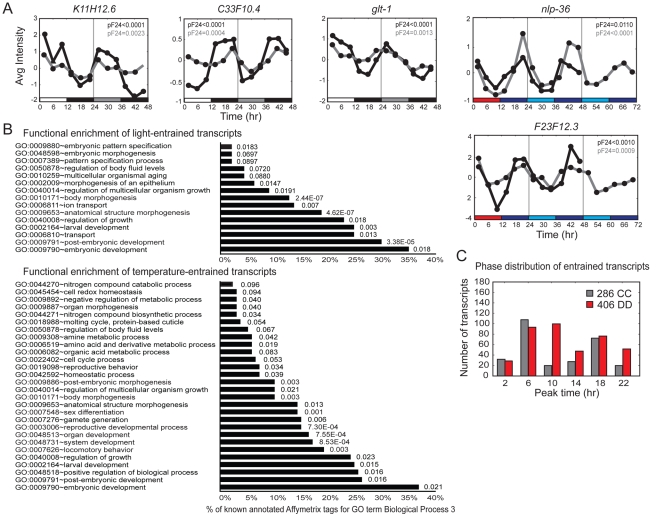
Figure 6. Analyses of light- and temperature-entrained circadian transcripts.
(A) Comparison of qRT-PCR (gray) and microarray expression array (black) data of randomly selected LD- and WC-entrained transcripts. Additional transcripts are shown in Figure S2. Bars below the graphs denote the entrainment protocols, with white, black, and gray bars indicating the light, dark, and subjective light phases, respectively, and with red, blue, and light blue indicating the warm (25°C), cold (15°C), and subjective warm phases, respectively. Data shown are an average of three biologically independent replicates per time point for the microarray data and two biologically independent replicates per time point for the qRT-PCR data. (B) Functional enrichment of light- and temperature-entrained circadian transcripts, as shown in Figure 5B. A complete list is provided in Table S3. (C) Histogram showing the estimated peak phases of the temperature- or light-entrained transcripts. The peak phases are organized into 4-h phase groups.

