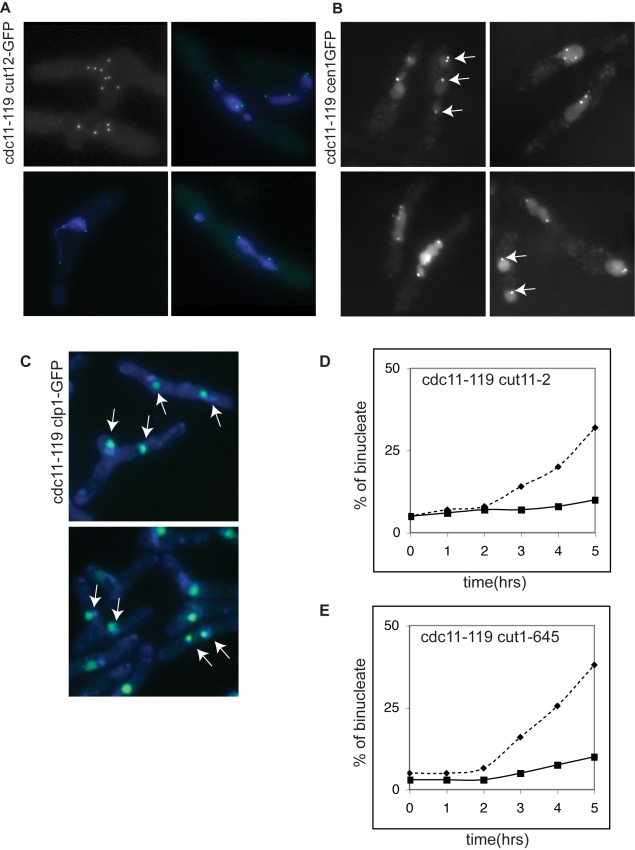
Figure 4. SPB and centromeres separation during nuclear fission.
(A) Cut12-GFP marked SPBs in cdc11-119 blocked cells treated with MBC for 6 h (top left) and costained with dapi (bottom panel and top right). (B) Cen1-GFP and (C) Clp1-GFP in cdc11-119 cells. In (C) cells were co-stained with dapi. Arrows point to separated nuclear DNA masses within the same cell containing cen1GFP (B) or clp1-GFP (C). (D) Quantification of percentage of binucleated cells with two nuclear masses in cdc11-119 (dashed), cdc11-119 cut11-2 (black), and (E) cdc11-119 cut1-645 (black) after MBC treatment. Scale bar 10 µm.

