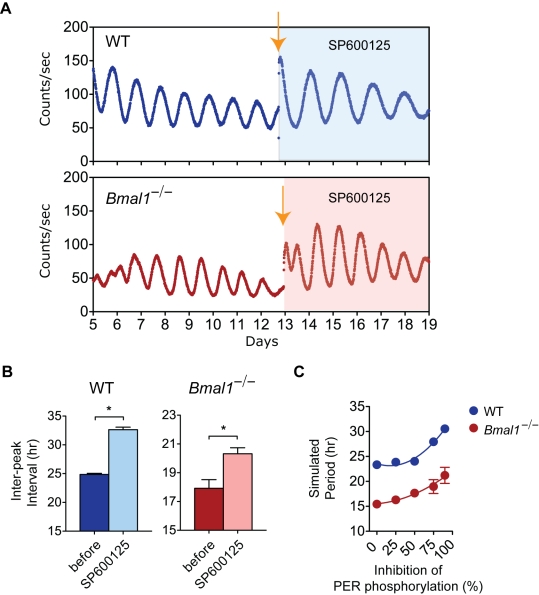
Figure 8. Effects of SP600125 on periodicity in WT and Bmal1 −/− SCN explants.
(A) Representative records of PER2::LUC rhythms from SCN explants of WT (top) and Bmal1 −/− (bottom) mice. Shown are 8 d of bioluminescence record before SP600125 treatment followed by 6 d of bioluminescence record during the SP600125 (25 µM) treatment (shaded). At the time indicated by orange arrow, individual SCN explants were changed into a fresh medium with the kinase inhibitor. (B) Average inter-peak intervals of PER2::LUC rhythms (±SEM) of WT (left; before = 24.86±0.19 h, SP600125 = 32.65±0.43 h) and Bmal1−/− (right; before = 17.92±0.60 h, SP600125 = 20.32±0.42 h) SCN explants. SP600125 treatment lengthened the intervals in both WT (paired t-test, p<0.0001, df = 5) and Bmal1−/− (paired t-test, p<0.0005, df = 6) SCN explants. (C) Average period (±SEM; n = 6 per data point) from simulated WT (blue) and Bmal1 −/− (red) SCN networks with varying percent inhibition of PER phosphorylation by CK1. The error bars (±SEM) cannot be seen in some of the data plots because the symbol is larger than the bar. Period values of WT and Bmal1 −/− SCN networks were significantly different from each other and as a function of inhibition of PER phosphorylation (two-way ANOVA, p<0.001).

