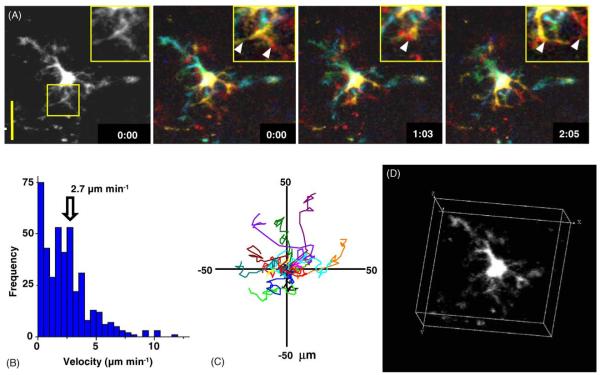
Fig. 3.
Dendritic cell gesticulations and motility. (A) High-resolution monochrome and color depth-encoded z-projections of a DC, illustrating elaborate dendritic morphology, shown at indicated times (in min:s); note rapid changes in morphology. Insets show enlarged views of the selected region. Scale bar = 25 μm. (B) Histogram of instantaneous DC velocities derived by tracking the center of fluorescence of 15 DCs in the x-y plane. (C) Tracks of 15 DCs in the x-y plane, normalized to their starting positions. (D) Three-dimensional representation of a DC, illustrating complex dendritic morphology. See also Video 1. Data are reproduced with permission from Miller et al. [5].

