Figure 1.

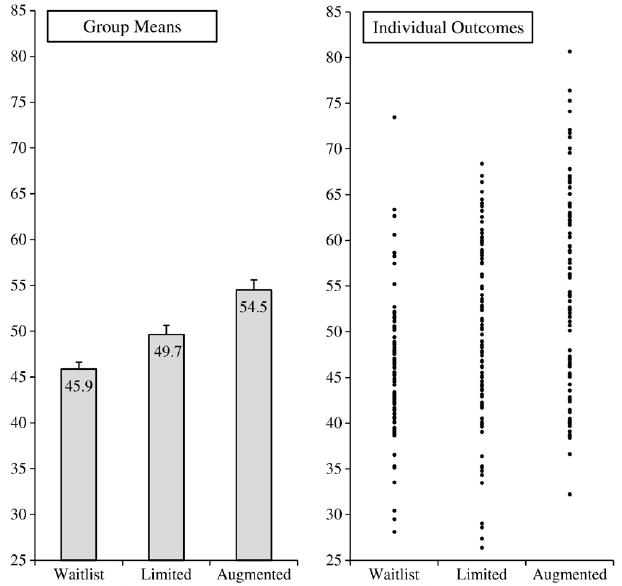
Group means and individual outcomes by treatment group.
Note: Symptom improvement levels are presented as t-scores, with an overall mean of 50 and a standard deviation of 10.

Group means and individual outcomes by treatment group.
Note: Symptom improvement levels are presented as t-scores, with an overall mean of 50 and a standard deviation of 10.