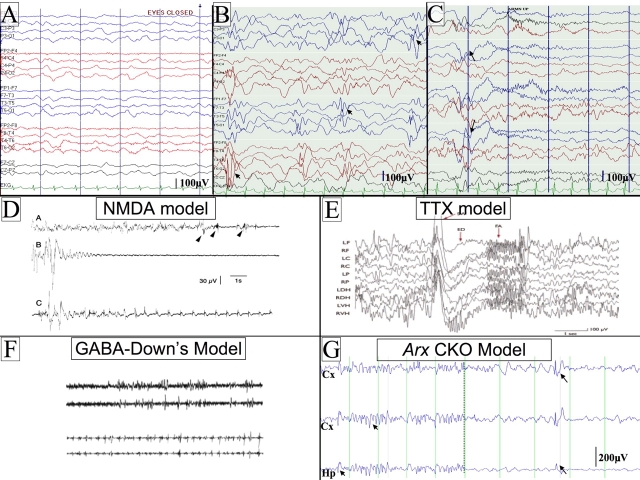
Fig. 1.
Examples of human and mouse hypsarrythmic EEGs and electrodecrements. (A) An example of a background EEG from a normal 6-month-old child. (B) An EEG from an infant with infantile spasms showing the classic EEG pattern of hypsarrythmia. The EEG is high voltage, disorganized and has frequent multifocal sharps (arrowheads). (C) An example of a clinical seizure with a flexor spasm and electrodecrement on an EEG (see arrows for the onset of the seizure). Scale bars for the human tracings (100 microvolts) are presented in the lower right hand corner of each panel. The intervals between the vertical lines represent a duration of 1 second. (D–G) Rodent EEGs from four of the current models of IS. (D) NMDA model. The upper trace shows an abnormal EEG with onset of seizures (arrowheads). The middle trace shows an expanded scale of one of the seizures from the upper trace, showing electrodecrement. The lower trace shows a clustering of seizures. Figure reproduced with permission from John Wiley & Sons, Inc. (Velísek et al., 2007). (E) TTX model. An example of an abnormal EEG and electrodecrement with seizures. A large spike and wave is presented, followed by fast activity; the EEG is abnormal preceding the seizure. Figure reproduced with permission from Wiley-Blackwell (Lee et al., 2008). (F) GABA in Down’s syndrome mouse model. Two pairs of tracings are shown. The upper pair represents the abnormal EEG from the Down’s syndrome mouse. The lower pair shows seizures that occur in clusters after injection of GABA agonist. Figure reproduced with permission from The International Pediatric Research Foundation (Cortez et al., 2009). (G) Arx CKO mouse model (Marsh et al., 2009). The traces on the left of the panel show an EEG from an awake Arx CKO adult male mouse. Notice that the EEG is high voltage with frequent sharps (arrowheads). The traces on the right show an example of a clinical seizure with a flexor spasm and electrodecrement on the EEG (the arrows show the onset of the seizure) in the Arx CKO mouse. Scale bars are given for each rodent EEG recording. In G, the distance between vertical lines represents a duration of 1 second. Abbreviations: Hp, hippocampal electrode; Cx, cortical electrode; μV, microvolts; SW, spike wave; ED, electrodecrement; FA, fast activity. The montage names on the left side of A,B are the same for the tracings in C.

