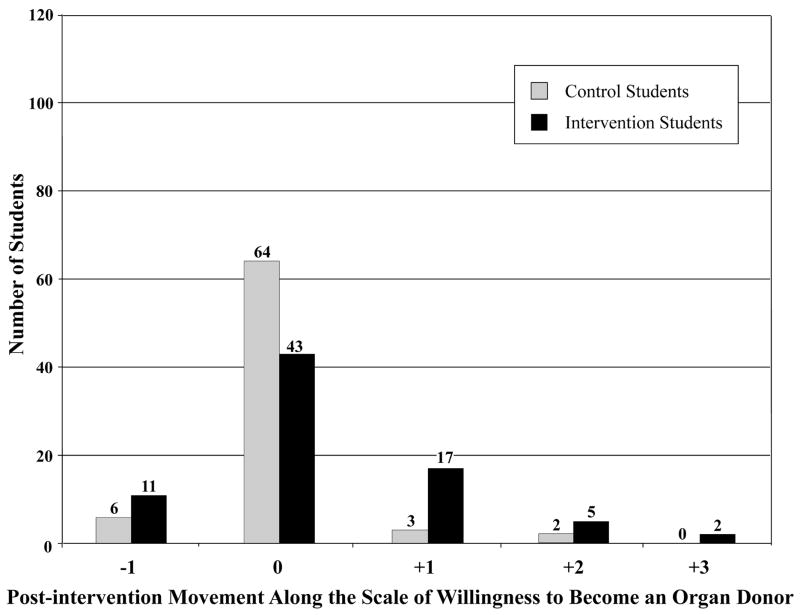
Figure 1.
Changes in willingness to donate between the first and second surveys. Net movement along the scale of levels of willingness to donate is characterized as the number of stages of positive or negative change for students in the control vs. intervention groups. No students had a negative change in willingness to donate of more than one stage.

