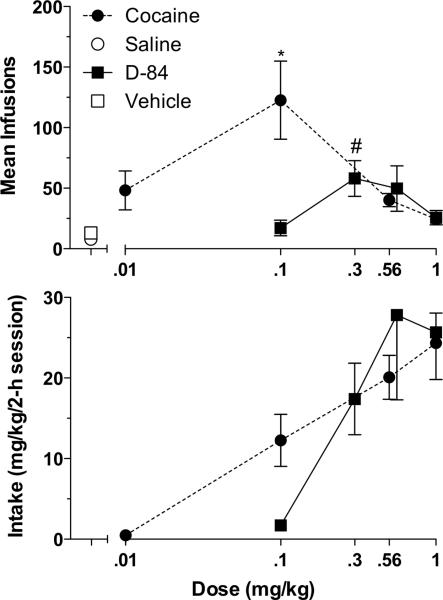
Fig. 2.
Upper panel: Mean infusions of saline (unfilled circles) and D-84s vehicle (unfilled squares), and of cocaine (filled circles) and D-84 (filled squares) obtained as a function of dose. Brackets through data points indicate ±S.E.M.. N=6 at all conditions. * = P< 0.05 as compared to saline; # = P< 0.05 as compared to vehicle.
Bottom panel: Mean drug intake (mg/kg/2-h session) as a function of dose. Other details as described for the upper panel.

