
Fig. 4.
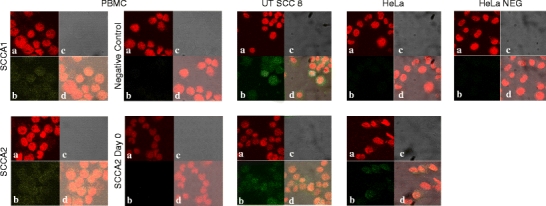
SCCA1 and SCCA2 expression (green) in stimulated PBMC and UT-SCC-8 and HeLa cell lines. Confocal microscope images. a Chromomycin-stained nuclei (red), b SCCA 1 or SCCA 2 fluorescence, c transmitted light images, d an overlay of panels b on a, illustrating the cytoplasmic fluorescence