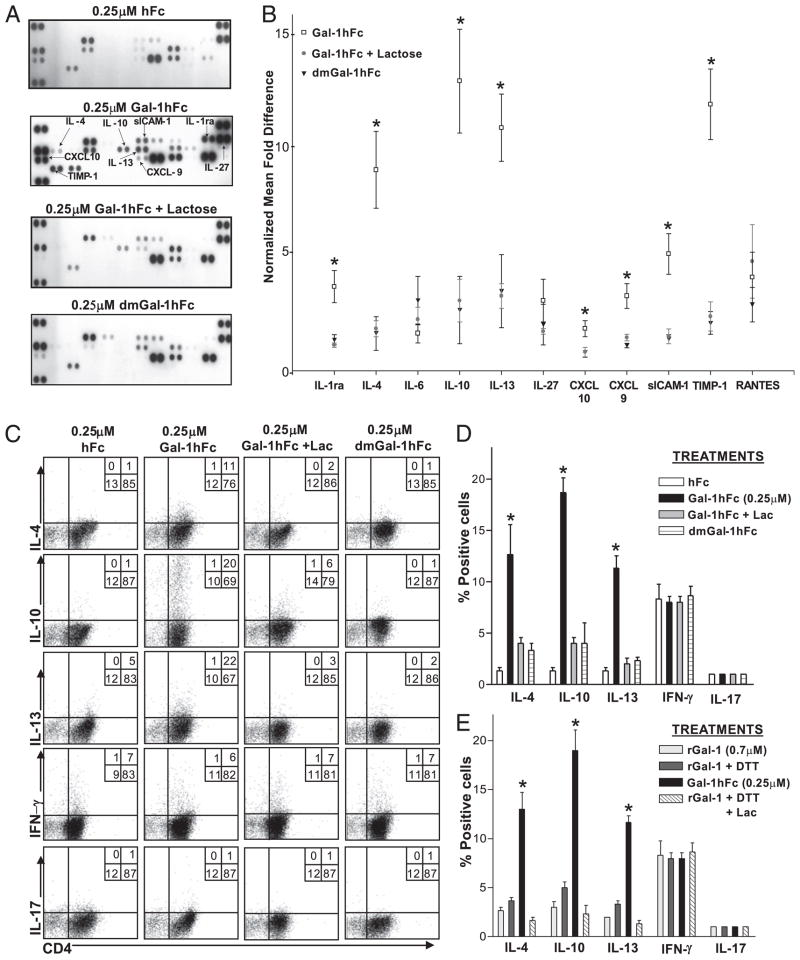
FIGURE 5.
Gal-1hFc stimulates the secretion of immunoregulatory molecules and alters Th cell differentiation. A, Naive Th cells were isolated by immunomagnetic beads from mouse spleens and activated for 48 h with anti-CD3/CD28, and further incubated for an additional 24 h with Gal-1hFc (±50 mM lactose), control hFc, or dmGal-1hFc. Supernatants were collected and analyzed for expression of 40 cytokines with a mouse cytokine panel array kit and quantified by OD, and mean densities were normalized to hFc-treated group. The complete list of cytokines and their spatial arrangement in the array are shown in Supplemental Fig. S2C. B, Graphic representation of data from three experiments is shown as normalized mean fold difference. *Statistically significant difference compared with lactose control, p ≤ 0.01. C, Activated Th0 cells incubated with Gal-1hFc (0.25 μM) or controls for 24 h were stimulated with PMA/ionomycin in the presence of brefeldin A for 6 h and then stained with anti–IL-4, –IL-10, –IL-13, –IFN-γ, and –IL-17 mAbs, and analyzed by flow cytometry. D, Graphic representations of data from three experiments are shown. *Statistically significant difference compared with hFc control, p ≤ 0.01. E, Activated Th0 cells were incubated with 0.7 μM rGal-1 with or without 80 μM DTT (± lactose [Lac]) for 24 h, stimulated with PMA/ionomycin in the presence of brefeldin A for 6 h, and then stained with anti–IL-4, –IL-10, –IL-13, –IFN-γ, and –IL-17 mAbs, and analyzed by flow cytometry. Data from three independent experiments are shown. *Statistically significant difference compared with rGal-1, p ≤ 0.01. Representative FACS plots are shown in Supplemental Fig. 2D.

