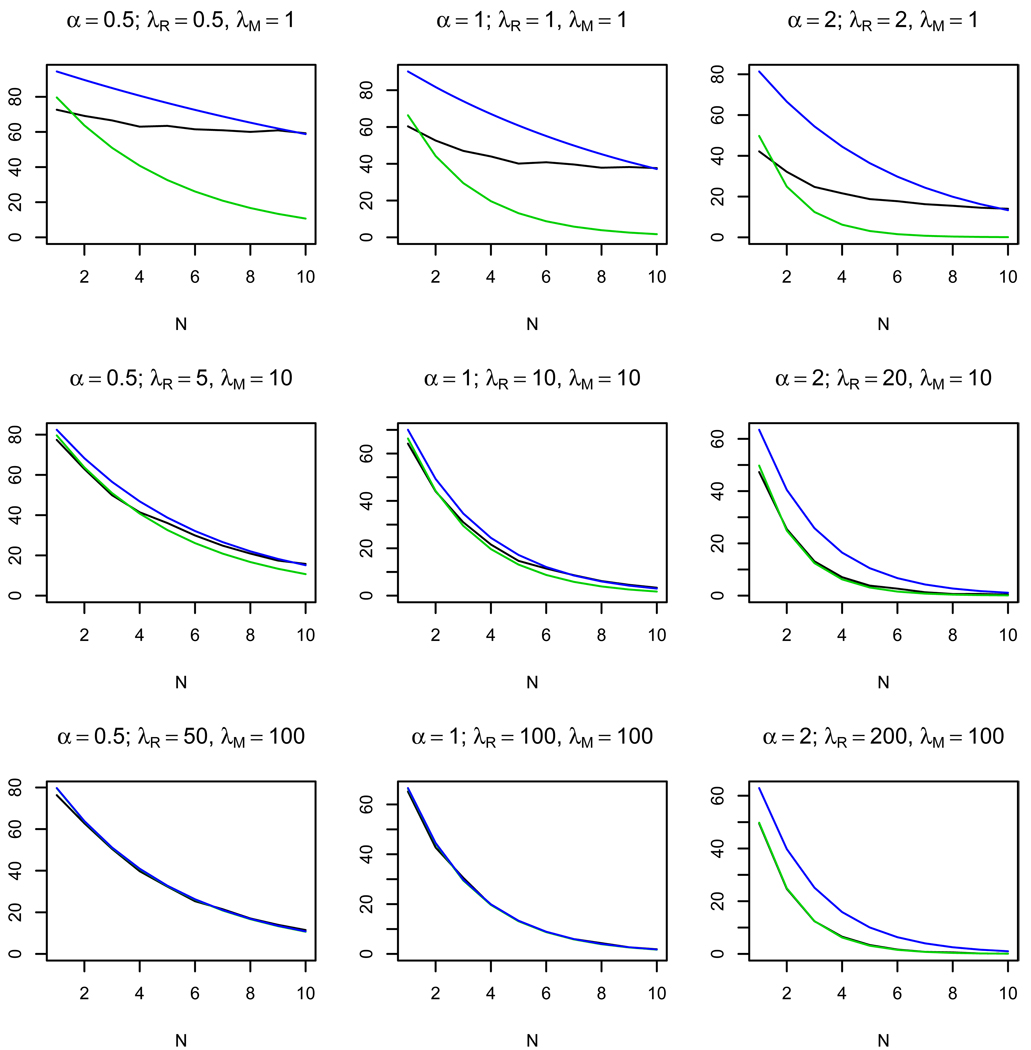
Figure 3.
Plots of the observed average number of killed cells (black line), the approximate average number of killed cells (green line), and the estimate of the average number of killed cells (blue line) depending on the number of restriction sites N. 103 simulations were made for τ = 0.5 for K = 103 bacterial cells. The approximate formula (3) works well for λM, λR ≥ 5 and α = λR/λM ≤ 1.

