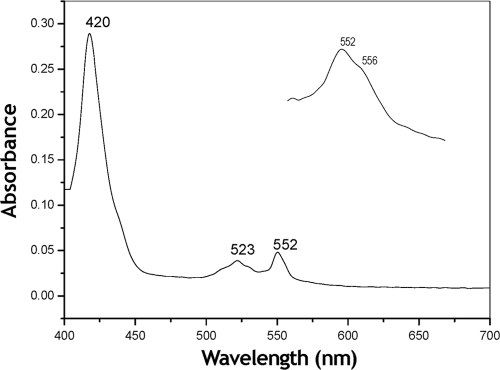
FIG. 2.
Visible-light absorption spectrum of the purified aldehyde dehydrogenase complex from Ga. diazotrophicus. The dithionite-reduced minus the persulfate-oxidized difference spectrum is depicted and was taken at an enzyme concentration of 0.3 mg ml−1 in 10 mM potassium phosphate buffer (pH 6.0) containing 0.1% Triton X-100. The inset shows the amplified α band of the spectrum.

