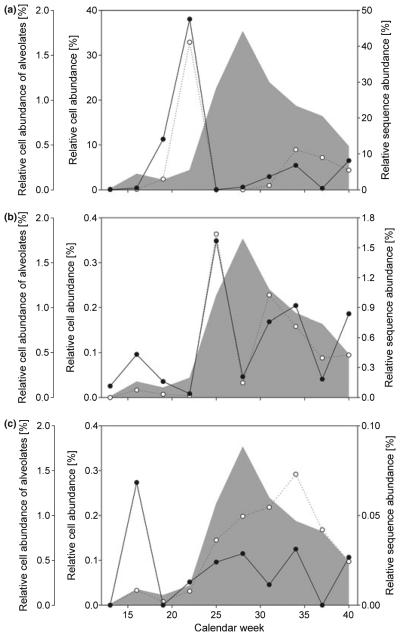
Fig. 3.
Relative abundance of species and their respective sequences. With an increasing correlation between species cell abundance (white dots) and alveolate cell abundance (grey shaded area) seasonal changes are less efficiently captured by sequence abundances (black dots). See text and Table 1 for explanation. (a) Dinobryon divergens and Dinobryon bavaricum; (b) Balanion planktonicum; (c) Ceratium hirundinella.

