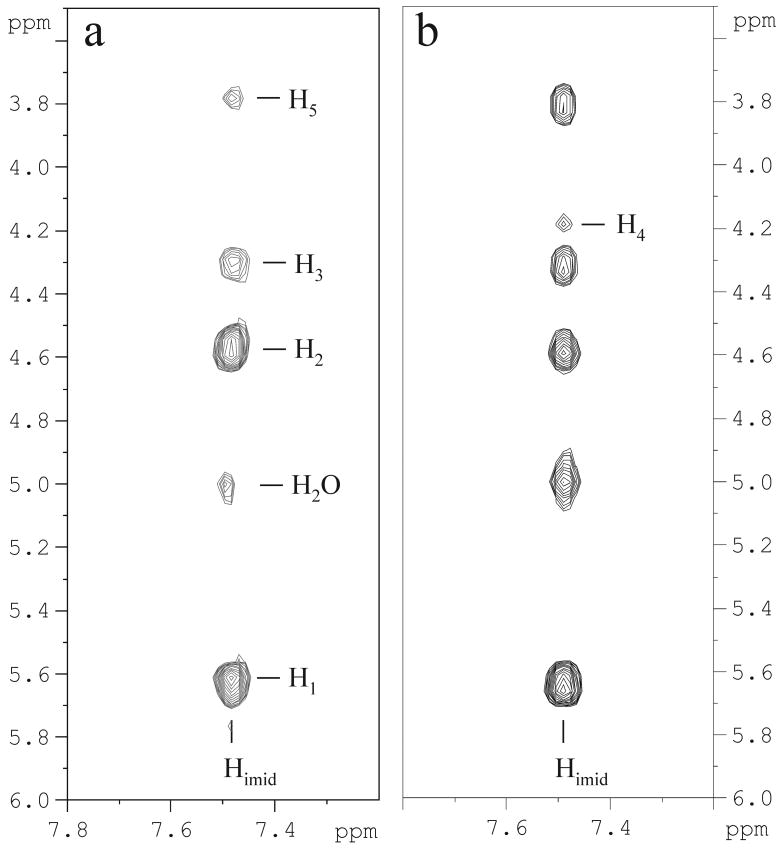
Figure 3.
Selection of NOESY spectrum of free AICAR (panel a) and of Tr-NOESY of AICAR bound to Hsp90-NT (1:28 Hsp90-NT: AICAR ratio) (panel b) at 280 K on a 500 MHz Bruker spectrometer. A mixing time of 250 ms was employed. Cross peaks in panel a) have opposite sign with respect to diagonal peaks, while cross peaks in panel b) have the same sign as diagonal peaks. The assignment of the cross peaks is reported.

