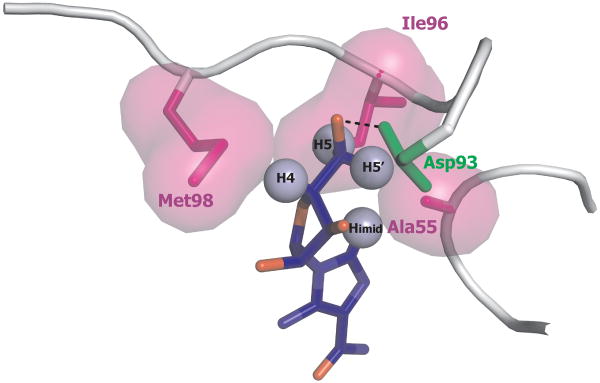
Figure 7.
AICAR/Hsp90 interface as deduced from NMR data and MD simulations. AICAR protons showing the highest saturation transfer from Hsp90-NT are labelled and represented as light blue spheres. Hsp90 residues Ala55, Ile96, Met98, making hydrophobic contacts with AICAR, are represented by their Van der Waals surface in magenta. The H-bond between the hydroxyl group in position 5 of AICAR ribose moiety with Asp93 side-chain, is depicted as a black dotted line.

