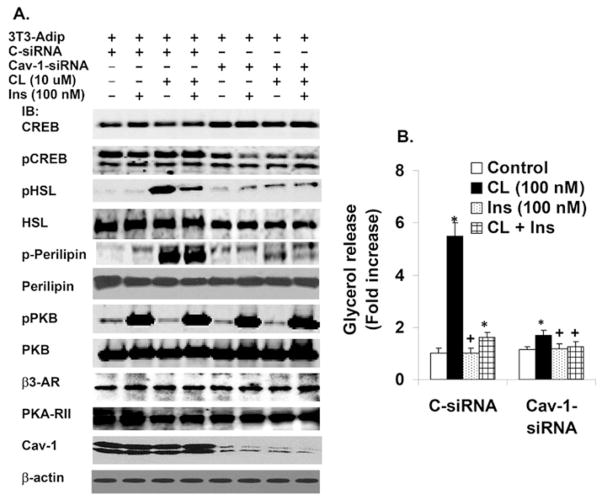
Figure 8. Effects of CAV-1 KD on lipolysis, and insulin- or CL-stimulated phosphorylation of PKB and PKA substrates.
3T3-L1 adipocytes (the same group of transfected adipocytes was used for experiments presented in Figures 8 and 9A–9C) were transfected with 100 nM CAV-1 siRNA or S-siRNA. After 72 h, adipocytes were incubated without or with 100 nM CL or 100 nM insulin (Ins) for 15 min, or a combination of the two as indicated. For the combination treatment the cells were treated with insulin for 10 min followed by CL for 15 min. (A) Cell lysates (30 μg) were prepared as described in the Materials and methods section, and subjected to SDS/PAGE and immunoblotted with antibodies against the indicated proteins. One representative experiment is shown (n = 3). (B) Adipocytes were incubated (in triplicate) without (control) or with the indicated concentrations of insulin (Ins) or CL for 1 h. Lipolysis (glycerol release) was measured as described in the Materials and methods section. Values (fold increase in glycerol release) represent the means+S.E.M. (n = 3). *P < 0.001 and +P = NS (not significant), compared with their respective controls.

