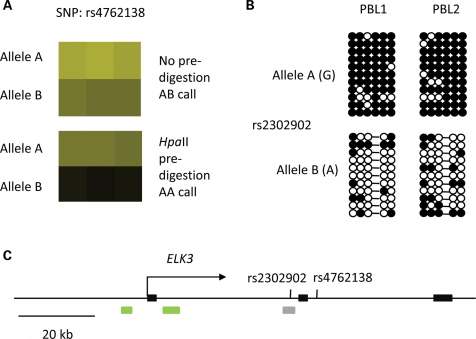
Figure 1.
Example of primary data and validations showing non-imprinted ASM. (A) Primary data from MSNP on Affymetrix 6.0 arrays. Pre-digestion of the genomic DNA (PBL sample) with the methylation-sensitive restriction enzyme HpaII prior to linker ligation and PCR for probe synthesis leads to a dropout of the B-allele, suggesting that this allele is relatively hypomethylated. (B) Validation by bisulfite conversion of genomic DNA followed by PCR, cloning and sequencing of multiple clones. Black circles are methylated CpG dinucleotides; white circles are unmethylated CpGs; the dash indicates a CpG SNP in one individual. The two alleles are distinguished in the group of clones by an SNP (rs2302902) that is not destroyed by the bisulfite conversion. Using pre-digestion/PCR assays, the hypermethylated allele was the A-allele at rs4762138 in each of 11 informative PBL samples, consistent with cis-regulation of DNA methylation. (C) Map of the ELK3 gene, containing the intragenic index SNP on the microarrays (rs4762138) and the nearby SNP (rs2302902) that was utilized for distinguishing the alleles in the bisulfite sequencing. The region with ASM subjected to sequencing (gray bar) is CG-rich but is not a CpG island; two CpG islands are near the gene promoter (green bars). Black rectangles are exons 1 and 2. The functional role of the allelic asymmetry at this position in the ELK3 gene is under investigation. Unpublished data are from K. Kerkel and B.T.

