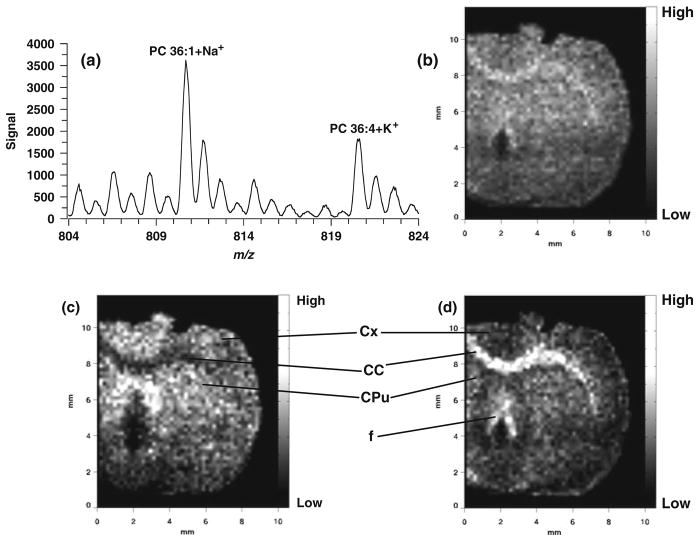
Fig. 5.6.
MALDI-IM images using DHB matrix in positive ion mode. (a) 1D mass spectrum obtained from section. (b) Image of m/z range 804–824. (c) Image of mass peak at m/z 810.6 (PC 36:1+Na). (d) Image of mass peak at m/z 820.5 (PC 36:4+K). Images are 51 × 60 pixels. Abbreviations: Cx – cerebral cortex; CC – corpus callosum; CPu – caudate–putamen; f – fornix.

