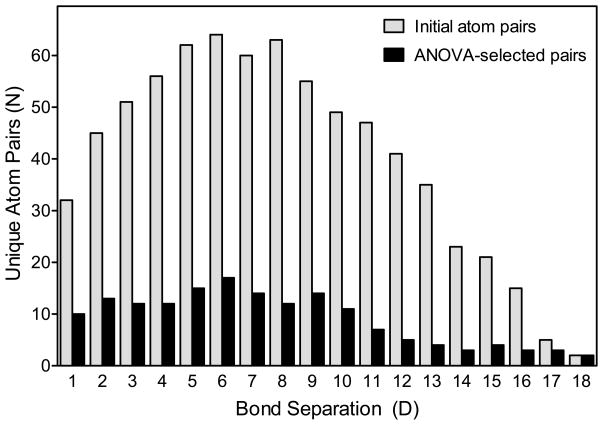
Figure 1.
Comparison of initial and ANOVA-selected atom pairs in compounds 1-71. The numbers are shown for each of the indicated bond separations initially generated for 71 compounds from Table 1 (light bars). Atom pairs subsequently selected by ANOVA as having significant differences between the three classes of compounds (FPR1 agonists, FPR2 agonists, and non-active compounds) are shown in dark bars.

