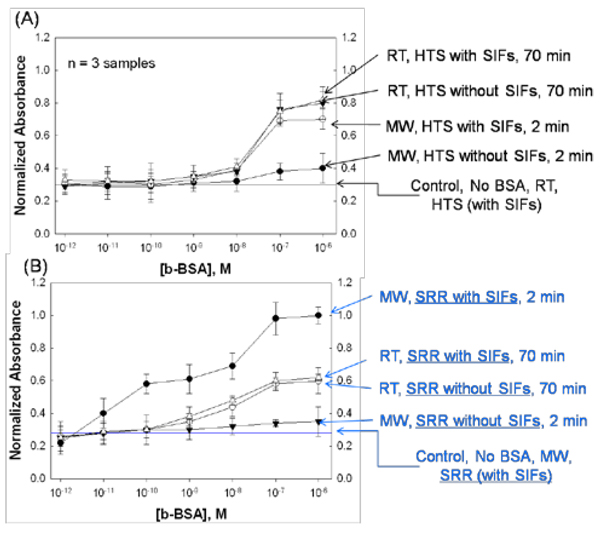
Figure 7.
Normalized absorbance at 450 nm for OPD after the completion of ELISA for the detection of b-BSA using (A) SRR structures (with SIFs) and microwaves and HTS wells (without SIFs) at room temperature and (B) control experiments. The absorbance values were normalized to the largest value observed: 10−6 M for ELISA denoted as “MW, SRR with SIFs, 2 min”. The average absorbance values for 3 different runs are shown. In the control experiment, b-BSA was omitted from the surface to determine the detectable concentration range using both methods.

