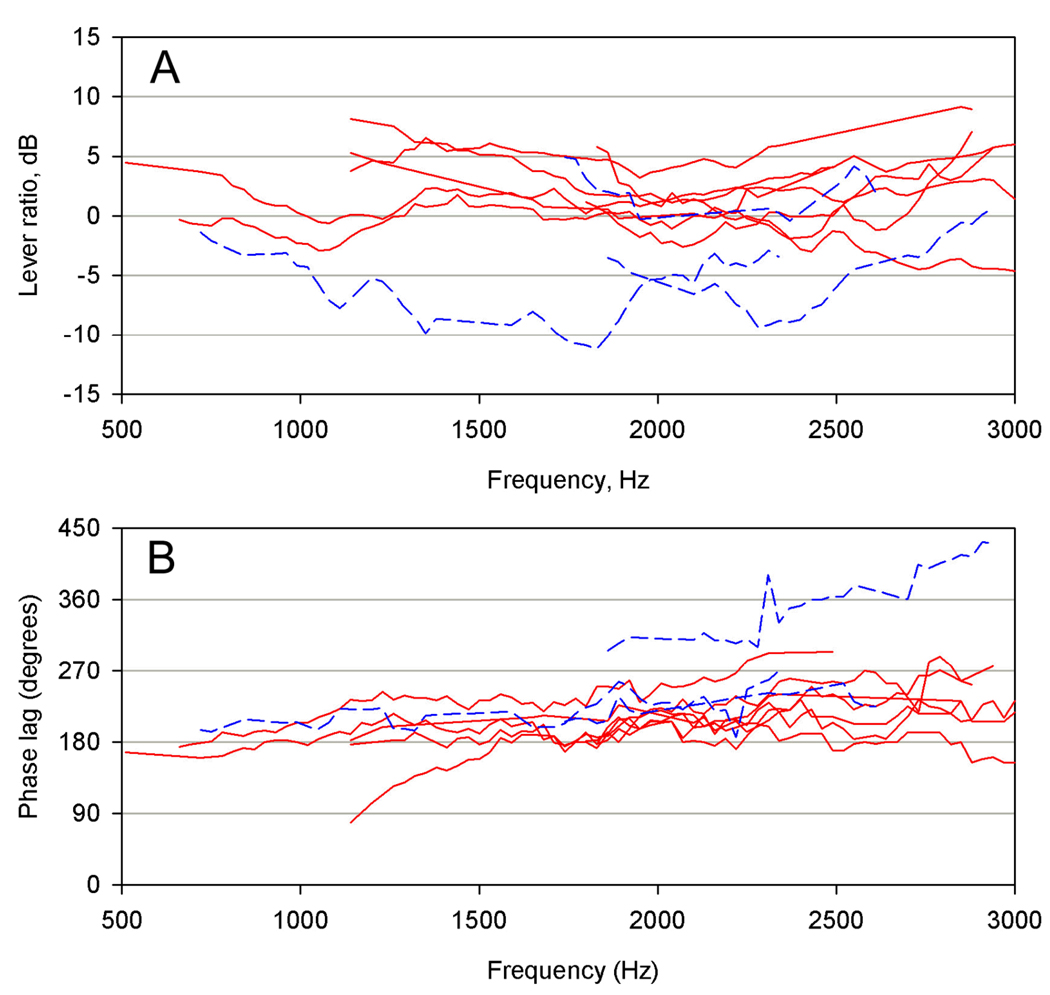
Figure 4.
Results of vibrometric experiments on 10 Xenopus frogs. Data were only included when the stapes response was >10 dB above that of the parotic crest. A: Lever ratios, calculated as the dB difference between tympanic disk and stapes footplate responses. B: Phase lags between tympanic disk and stapes footplate. Solid red lines = females, dashed blue lines = males.

