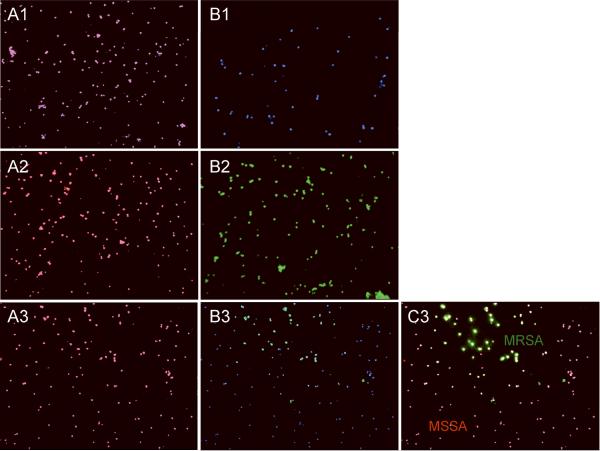
Figure 2. Detection discrimination of methicillin-sensitive (MSSA) versus methicillin-resistant (MRSA) strains.
Images of S. aureus bacterial cells observed by fluorescent microscopy in experiments performed with simulated matrix (packed red cells and blood culture media) spiked with S. aureus bacterial cells. A combination of two probes (SA-3 and MR-1) was applied to simulated matrix specimens spiked with: the regular MSSA strain (A1, B1); the Mu3 MRSA strain (A2, B2) and their mixture (A3, B3, C3). The fluorescent signals were acquired separately using three filter sets: A1, A2, and A3 present a superposition of two separate images, with DAPI and CY3; B1, B2, and B3 present a superposition of two separate images, with DAPI and FITC; C3 presents a superposition of three separate images, with DAPI, CY3 and FITC.

