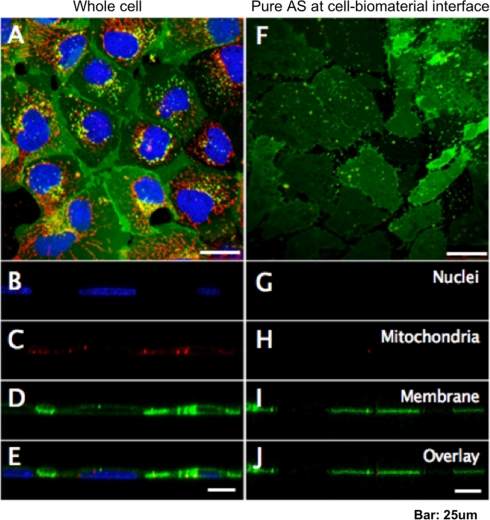
Fig. 3.
Morphology of isolated AS comparing to whole cell visualized with confocol microscopy. Fluorescence confocol micrographs on MDCK whole cells (A) and adherence surface (F). Nucleous, mitochondria and plasma membrane are shown as blue, red and green, respectively. Horizontal sections of (A) are shown in (B–E), and similarly (G–J) are correspond to (F).

