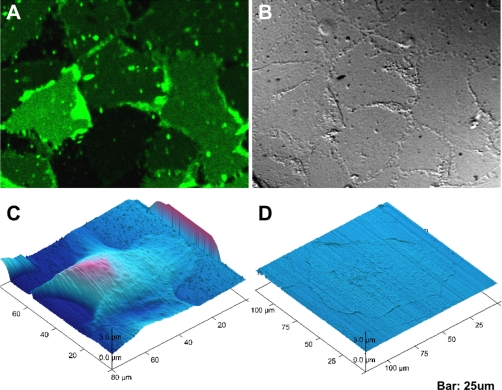
Fig. 4.
Morphology of isolated AS comparing to whole cell visualized by AFM and bright field (DIC). Fluorescence image of AS on substratum (A) is compared side by side with its differential interference contrast (DIC) image (B). AFM micrographs (C) shows the contour of whole cells while (D) shows contour of pure AS.

