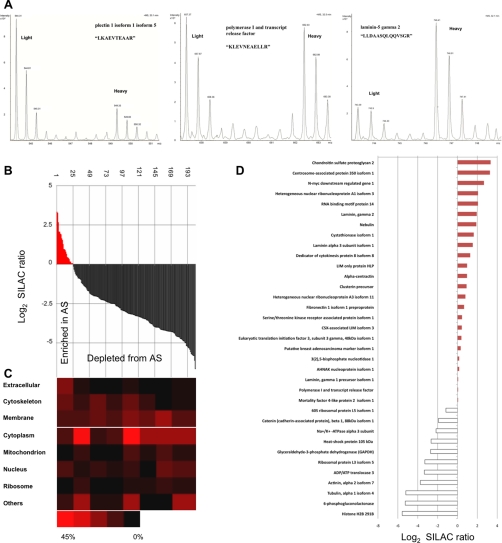
Fig. 5.
Proteomics analysis of AS proteins isolated from cell-biomaterial interface. A, shows SILAC pairs of three peptides in MS spectrums, which belong to plectin isoform 1 isoform 5, polymerase I and transcript release factor and laminin-5 gramma 2, representing “Depleted from AS” (left), “Equally distributed within cell” (Middle) and “Enriched in AS” (right). B, shows normalized H/L ratio of all identified & quantified proteins (204) in descending order, AS enriched proteins (normalized ratio > 0) are in red (24), AS depleted are in black (180). Heat map (C) is complemented to (B), showing proteins subcellular origin, according to GO, at different normalized ratio. D, shows noteworthy proteins and its normalized ratio.

