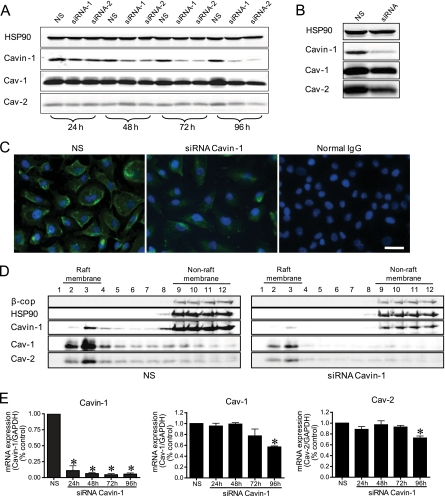
Fig. 3.
Characterization of Cavin-1 silencing in human ECs. Cavin-1 silencing in Eahy926 cells (A) and HUVECs (B). Cells were transfected with NS or with two independent siRNAs for Cavin-1 (siRNA-1 or siRNA-2), and at the indicated time points, protein levels were evaluated by immunoblotting. C, immunofluorescence microscopy of Cavin-1 (green) in Eahy926 cells in the absence or presence of Cavin-1 siRNA treatment. Blue reflects DAPI staining of nuclei, and the scale bar represent 25 μm. D, raft distribution of Cavin-1 and caveolins in control and Cavin-1-silenced Eahy926 cells. β-cop and HSP90 were used as markers for non-raft fractions. E, time course of mRNA expression of Cavin-1 and caveolins during Cavin-1 silencing. Gene expression data are expressed taking the control as reference (equal to 1). Values are the mean ± S.E. of three independent experiments. *, p < 0.05 (comparisons versus NS).

