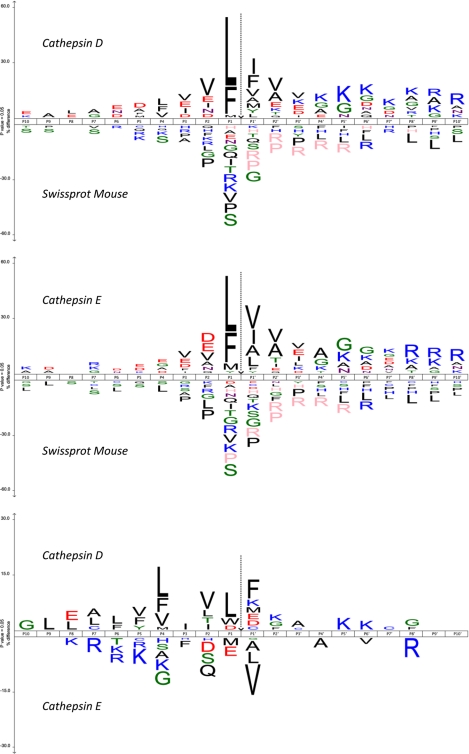
Fig. 3.
Sequence patterns at cathepsin D and E cleavage sites. In the upper and middle panels, the amino acid frequency at every subsite is compared with sampled frequencies in the mouse proteins stored in the Swiss-Prot database (negative control). Only residues that are statistically over-represented (upper part of the iceLogo) or under-represented (lower part of the iceLogo) at a 95% confidence level are depicted. Residues that were never observed at specific positions are shown in a pink color. In the lower panel, the cleavage site environments of the substrates of cathepsin D are compared with those of cathepsin E. Highly similar substrate specificity profiles were obtained for both cathepsins (upper and middle panels), although subtle specificity differences between both proteases appeared, especially at the unprimed site region (lower panel).

