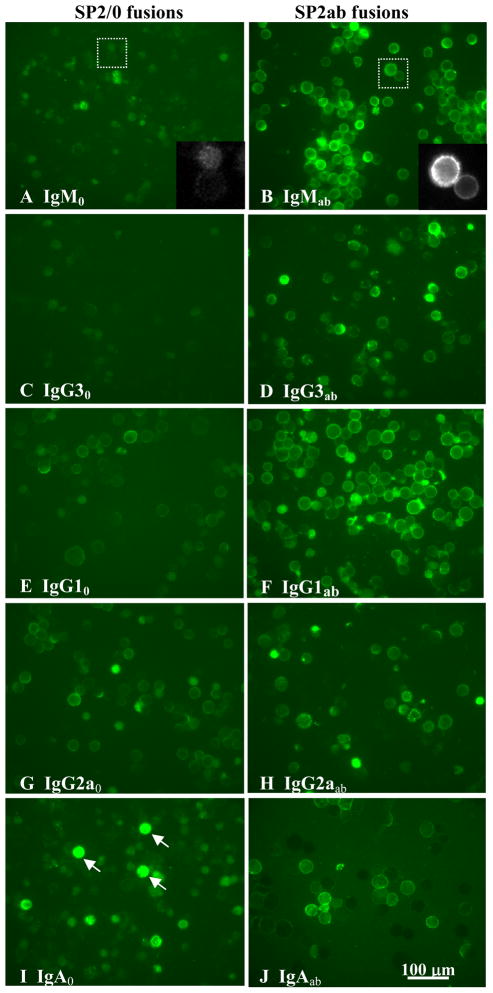
Fig. 5. Immunofluorescence microscopy of hybridomas expressing cell surface immunoglobulin.
Hybridomas derived from splenic cell fusions with either SP2/0 or SP2ab as the myeloma parent are compared: SP2ab fusions (right side-- B, IgMab; D, IgG3ab; F, IgG1ab; H, IgG2aab; j, IgAab) expressed membrane Ig on the cell surface at moderate to high levels, regardless of Ig isotype, while SP2/0 fusions (left side--A, IgM0; C, IgG30; E, IgG10; G, IgG2a0; I, IgGA0) did not express notable levels of membrane Ig on the cell surface, with the exception of lines expressing the IgG2a isotype (e.g., g, IgG2a0). Inserts in A and B show two cells enlarged. Cells were labeled with FITC-conjugated GAM Ig. The cell lines shown are the same as those analyzed for Igα expression and Ab production in Fig. 4. Example dead cells are indicated by arrows in plate I. Scale bars for the full-size plates is shown in J.

