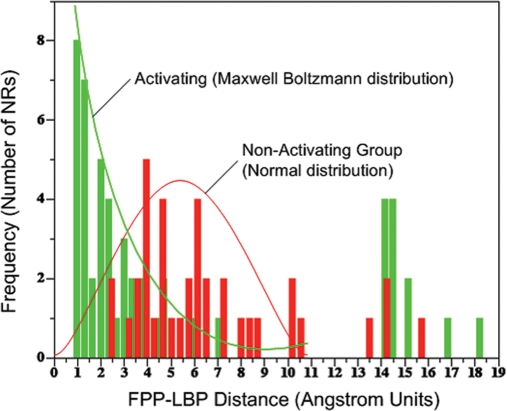
Fig. 5.
Histogram of the distributions of distances (in Å) between the center of mass of FPP located in its docked conformation and the geometric center of the LBP (FPP–LBP distance) for all the NRs tested in vitro. The histogram of distances corresponding to the NRs group activated by FPP is shown in green and describes a distribution similar to a Boltzmann distribution. The histogram of distances corresponding to the FPP-non-activated group of NRs is shown in red and clearly describes a separate population exhibiting a normal distribution. An FPP–LBP distance of ≤2 Å represents a hyperplane between the two distributions that distinguish the activated from non-activated population with nearly 100% sensitivity and specificity. Thus, a high-throughput screen of many NR mutants can be performed automatically as a molecular engineering tool in silico to find those mutations that either disturb FPP docking beyond 2 Å or rescue FPP docking to within 2 Å. The use of this cutoff may be general to the engineering of the interaction of any ligand with any NR.

