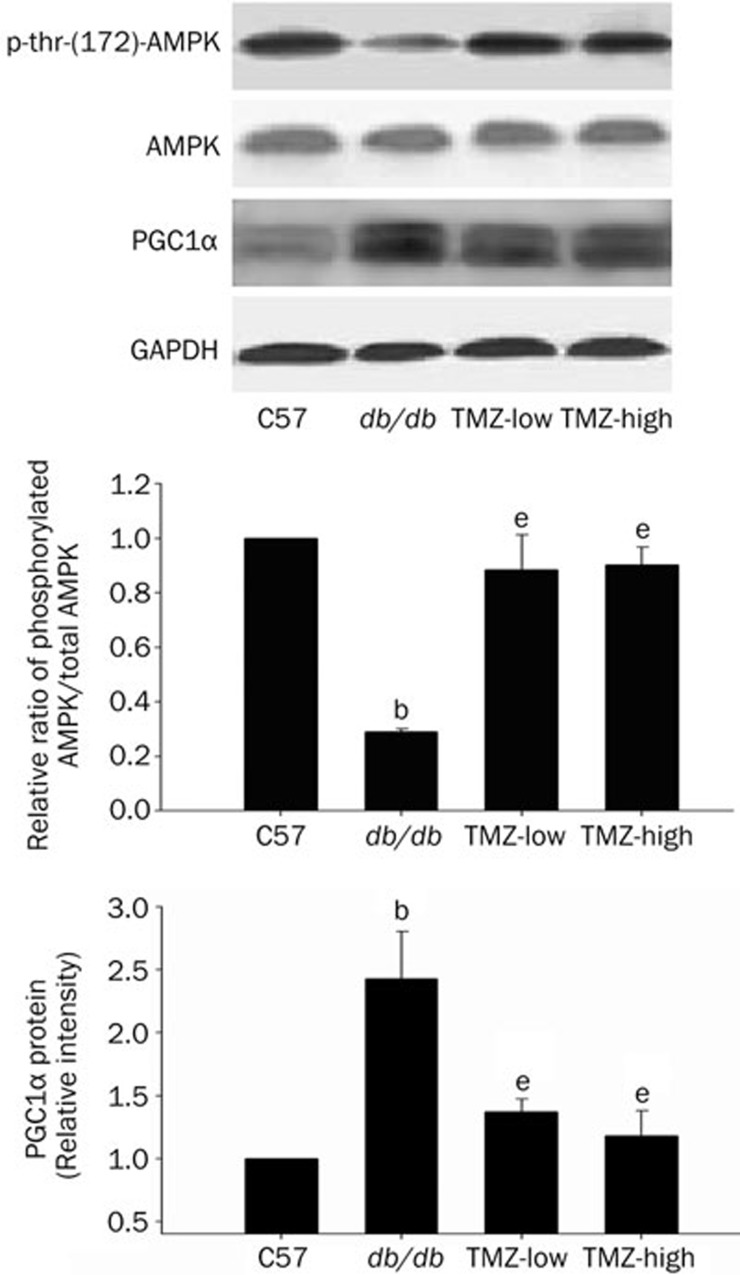
Figure 6.
AMPK phosphorylation and PGC1α expression in C57, db/db, TMZ-low, and TMZ-high mouse heart tissue. Top panel: p-AMPK, AMPK, and PGC1α levels in hearts from each group were determined by Western blot analysis. Middle and bottom panels: quantitative analysis of p-AMPK, AMPK, and PGC1α in heart tissue. Values represent the mean±SEM of the relative densitometric intensity normalized to a control and expressed as % control±SEM from three experiments. bP<0.05 compared to the C57 group; eP<0.05 compared to the db/db group.

