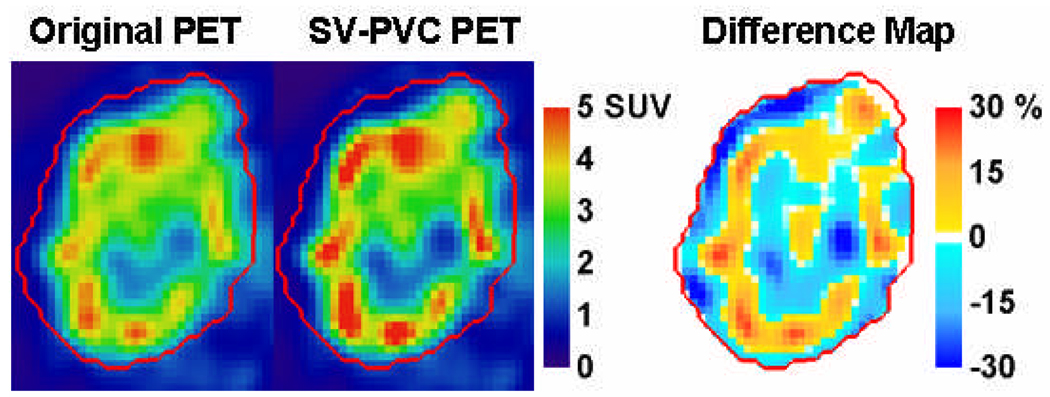
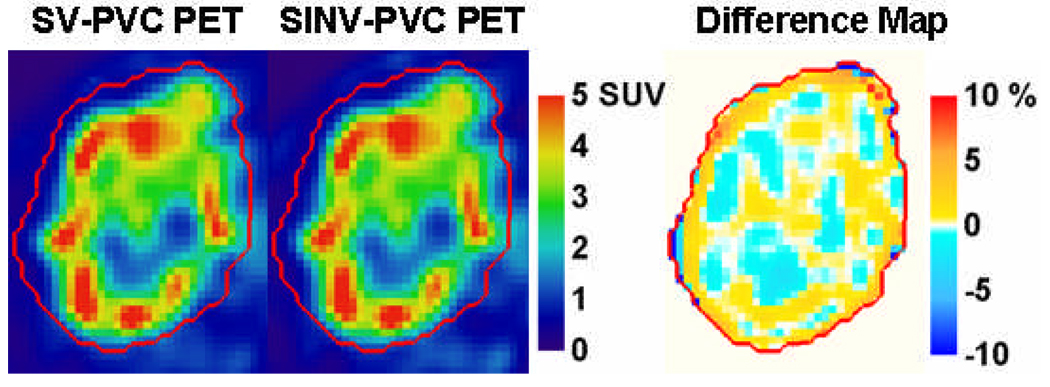
Figure 7.
61Cu-ATSM images of a patient’s node before and after spatially variant PVC (top row) and a comparison between spatially variant and spatially invariant PVC (bottom row). The right column displays the percentage difference of the middle column relative to the left column image. The CT delineated tumor mask is defined by the red contour.


