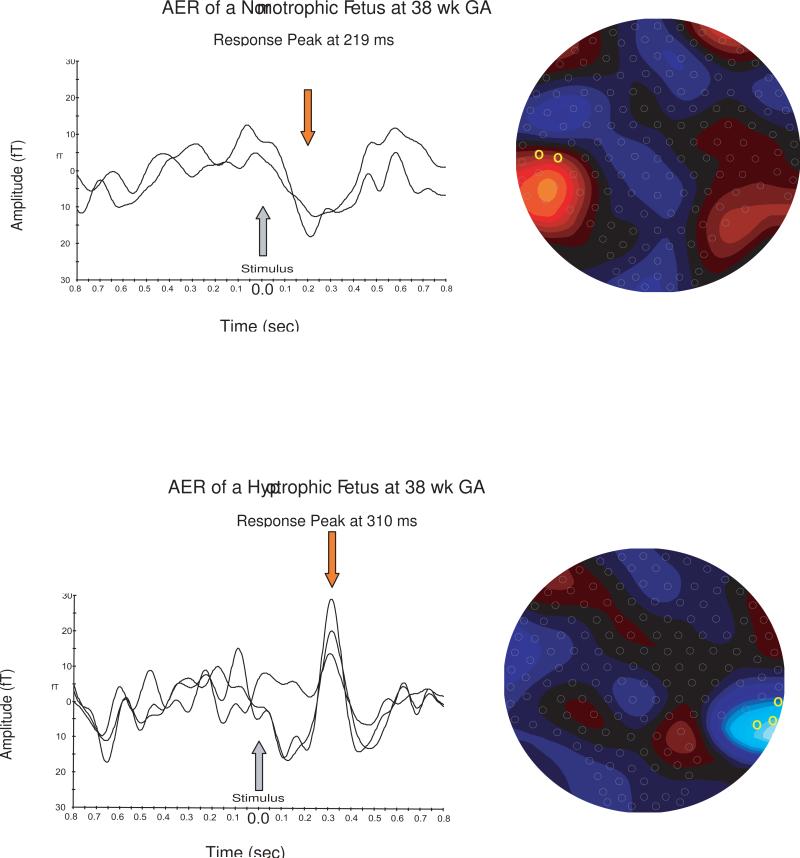
Figure 2. AER of a normotrophic and a hypotrophic fetus at 38 week of gestation.
The graphs on the left side show the channels with the clearest from the baseline deviating response peaks for each fetus. The location of the chosen channels and the dipole of the evoked magnetic field in the sensor array are plotted on the right side.

