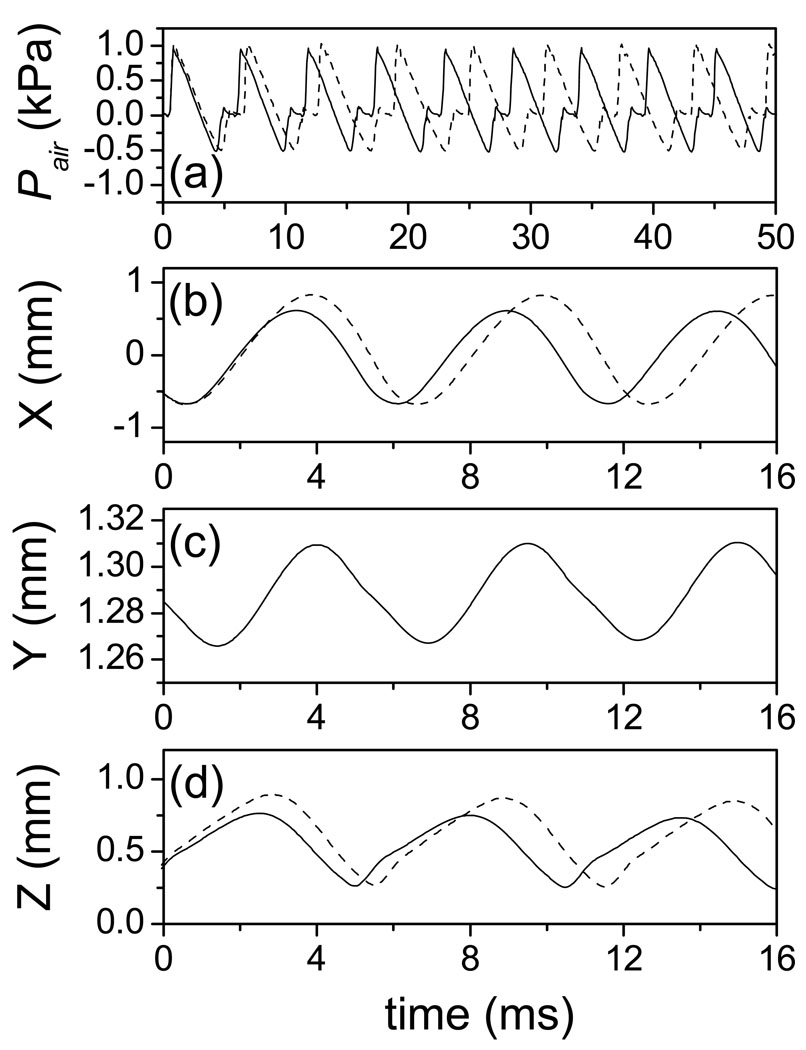
Figure 7.
The air pressure in glottis and the node displacements on vocal fold surface with the lung pressure of PL = 1.0 kPa, where the solid lines and the dashed lines correspond to the elongation length Le = 2.4 mm and Le = 0.0 mm respectively. (a) the waveform of intralglottal air pressure. (b, c, d) the node displacement in x, y, and z direction for the 3rd node from the top left edge in the anterior-posterior mid-plane of vocal fold.

