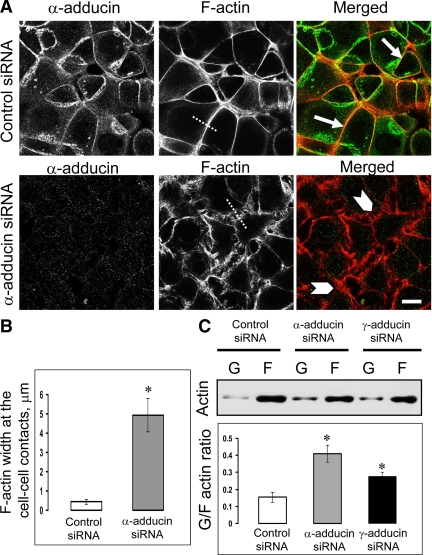
Figure 8.
Down-regulation of adducins affects organization of the actin cytoskeleton. (A) Fluorescence labeling shows rapid formation of the circumferential F-actin belt at the intercellular junctions of control SK-CO15 cells during 1 h of calcium repletion (arrows). By contrast, α-adducin–depleted cells demonstrate diffuse and disorganized perijunctional actin filaments (arrowheads). Bar, 10 μm. (B) Measurements of the lateral width of perijunctional F-actin on cross-sections through cell-cell contacts (indicated by dotted lines on Figure 8A) show significantly less compact F-actin bundles in α-adducin–deficient SK-CO15 cells compared with control cell monolayers. *p < 0.0001 compared with control siRNA-transfected cells (n = 50). (C) Immunoblotting analysis of monomeric (G-) and filamentous (F)-actin fractions demonstrates significant increase in the G/F actin ratio in α- and γ-adducin–depleted cells. *p < 0.05 (n = 3).

