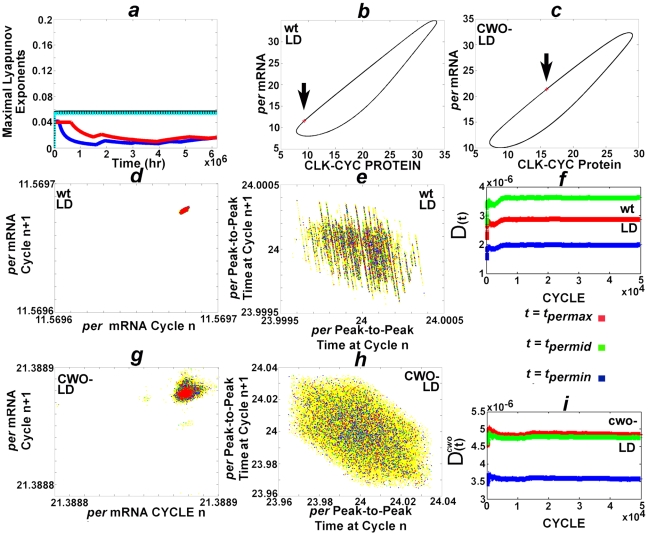
Figure 3. Chaotic attractors and almost periodic orbits in LD.
(a) plots the positive maximal Lyapunov characteristic exponents of the wt model in LD (blue), wt model in DD (black), cwo-mutant model in LD (red), and the cwo-mutant model in DD (cyan), respectively. (b) and (c) plot the orbits from cycle 100 to 120,000 of the wt and cwo-mutant models in LD, respectively. Observe that the trajectories remain confined to limit cycles. In addition, the orbits revisit the same neighborhoods at ZT = 0 in LD (arrows pointing to red X). (d) and (g) are recurrence plots of consecutive levels of per (arbitrary unit) at ZT = 0 in the wt and cwo-mutant models, respectively; the following cycles are plotted in this order, 1) cycles 70,000 to 120,000 (yellow), 2) 115,000–120,000 (blue), 3) 115,00–116,000 (green), and 4)119,000–120,000 (red). (e) and (h) are recurrence plots of consecutive peak-to-peak times (hr) of per in the wt and cwo-mutant models, respectively; the following cycles are plotted in this order, 1) cycles 70,000 to 120,000 (yellow), 2) 115,000–120,000 (blue), 3) 115,00–116,000 (green), and 4)119,000–120,000 (red). (f) and (i) plot  and
and  for
for  ; similarly,
  for
for  , where
  refers to direct target genes tim, cwo, pdp1, and vri. The unit of the y-axes of (b) and (c) is arbitrary.

