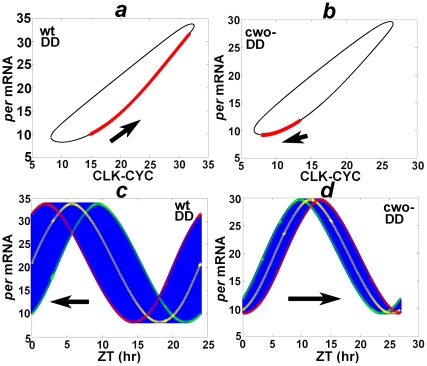
Figure 4. Phase shifts in DD.
(a) and (b) plot the trajectories of the orbit from cycle 100 to 120,000 of the wt and cwo-mutant models in DD, respectively. Observe that the trajectories remain confined to limit cycles. However, unlike the limit cycles in LD (Figures 3b–c), the position of ZT = 0 (red X) in the limit cycle migrates in the direction of the arrows as cycles advance (a, cycles 100 to 20,000; b, cycles 100 to 120000). (c) and (d) plot recurring orbits of the wt and cwo-mutant models in DD; the phase exhibits minute shifts to the left and to the right at the end of each cycle in the wt and cwo-mutant models, respectively (arrows). The per mRNA oscillation in the first (cycle = 100), middle (c, cycle = 10000; d, cycle = 60000) and last cycles (c, cycle = 20000; d, cycle = 120000) are labeled in green, yellow, and red respectively. The unit of the y-axis is arbitrary.

