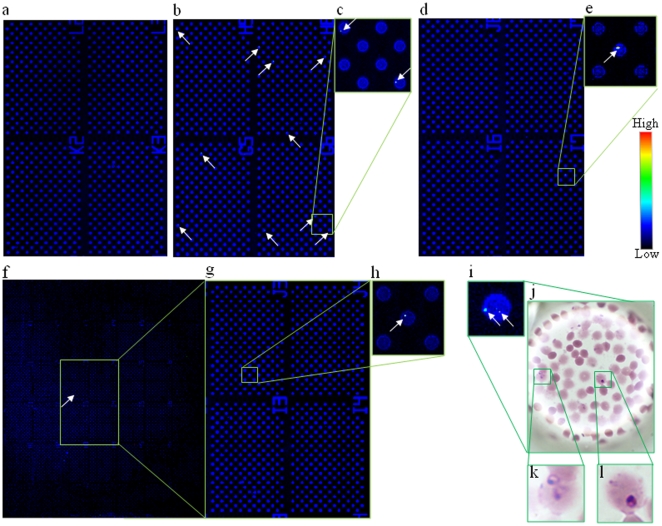
Figure 4. Detection of malaria-infected erythrocytes using a cell microarray chip.
(a–i) Scanned images of malaria-infected erythrocytes on a microarray chip obtained with a microarray scanner. (a) Negative control (uninfected erythrocytes). (b, d, f) Malaria-infected erythrocytes (0.01, 0.001, and 0.0001%) were scanned in 4, 4, and 42 clusters on the microarray chip, respectively. (c, e, g, h) Magnified views of the boxed regions. (i) Microarray scanning images of malaria-infected erythrocytes. (j, k, l) Giemsa staining results for the cell microarray chip. (k, l) Two malaria-infected erythrocytes were observed in the microchamber on Giemsa staining.

