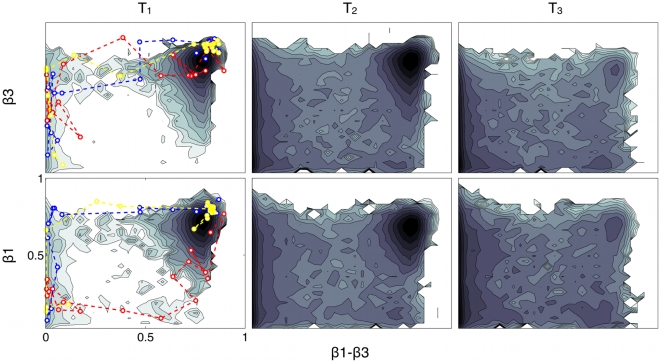
Figure 5. FES as a function of  –
– vs.
vs.  contacts (top panels) and of
  –
– vs.
vs.  contacts (bottom panels) at T
 = 0.969, T
 = 0.998 and T
 = 1.021.
FES are obtained by reweighting the structure-based potential PTMetaD simulation. Isoenergy lines are drawn every  . In dashed lines, projection of the relevant part of the all-atom explicit-solvent unfolding simulations at 700K (blue and red) and 500K (yellow).

