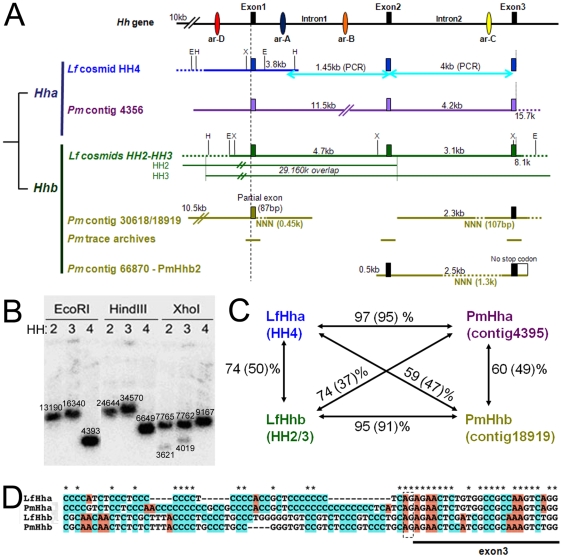
Figure 1. Organisation of Hha and Hhb loci in Lampetra (Lf) and Petromyzon (Pm).
A, Sequence information available after library screening (Lf cosmids), in silico searches (Pm contigs and trace archives) and PCR amplification is schematically depicted. Drawing is not to scale. The top row shows a “generic” Hh gene, with 3 exons (black boxes) and 2 introns containing previously described regulatory elements (coloured ovals, ar-A, B, C, and D; see text). Below, Hha genes are drawn in blue/purple, Hhb genes are drawn in green/kaki. The sizes of introns and the overall length from ATG to Stop codons are indicated. Restriction sites for enzymes EcoRI (E), HindIII (H) and XhoI (X) used for Southern analysis of the cosmids are indicated (restriction sites located on the Lawrist7 vector are not indicated). The trace archives for putative PmHhb exonic sequences have the following IDs (plus and minus are directions for assembly). For exon1: gnl|ti|1427444168+, gnl|ti|1179676842+, gnl|ti|1483498011+, and gnl|ti|1482777522-. For exon2: gnl|ti|1484276315+ and gnl|ti|1482717043+. For exon3: gnl|ti|1470810056+, gnl|ti|1213886743+, gnl|ti|1193744006-, and gnl|ti|1192802884-. B, Southern blot of Lf cosmids HH2, 3, and 4, using the partial previously isolated Lf cDNA encompassing most of exon1 (174 nt) and part of exon2 (100 nt) [23] as a probe (see Figure 2C for probe localisation on cDNA). Restriction enzymes and band sizes (in bp, obtained from in silico restriction digest of the HH cosmid sequences) are indicated. C, Similarity between each coding region and entire locus (in parenthesis) of the lamprey Hh genes. Nucleotide sequences were aligned with the CHAOS/DIALIGN program and the percent identity was calculated using the ClustalX program (ver2.11; [27]). The values show high similarities between the orthologs even when including intronic regions (see the value in the parentheses), while it is much lower between paralogs despite genes of the same species. D, An example of alignment showing the high sequence identity between orthologs and the lower sequence identity between paralogs of lamprey Hh genes. The sequence shown is at the level of the intron2-exon3 junction. The splice acceptor site (AG) is indicated.

