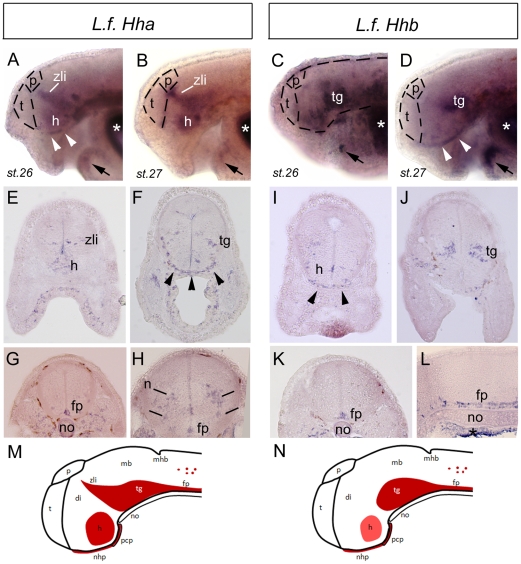
Figure 3. Compared expression patterns for LfHha and LfHhb in Lampetra embryos.
A-D show in toto in situ hybridisation photographs for LfHha (A and B; left) and LfHhb (C and D; right). Stages are indicated. Anterior is to the left and dorsal is to the top. Dotted lines delineate the brain in A, and the telencephalon and pineal gland in A to D. E-L show in situ hybridisation photographs for LfHha (E-H; left) and LfHhb (I-L; right) on transverse sections (except L, saggital section) through the head of stage 27 Lampetra embryos. Sections are organised from the most anterior to the more posterior parts of the embryos. M-N show schematic summary drawings of the expression patterns for LfHha (M; left) and LfHhb (N; right), where Hh expression is red and the intensity of red is related to the expression density observed reproducibly on many sectioned embryos in independent experiments. In all panels, arrowheads indicate expression in a placodal structure identified as the nasohypophyseal placode (nhp) underlying the diencephalon in the continuity of the prechordal plate (pcp), arrows point to lower lip expression, and asterisks indicate background trapping in the branchial arches cavities. Abbreviations are: di, diencephalon; fp, floor plate; h, hypothalamus; p, pineal gland; pcp, prechordal plate; mb, midbrain; mhb, mid-hindbrain boundary; n, unidentified neuronal populations; nhp, nasohypophyseal placode; no, notochord; t, telencephalon; tg, tegmentum; zli, zona limitans intrathalamica.

