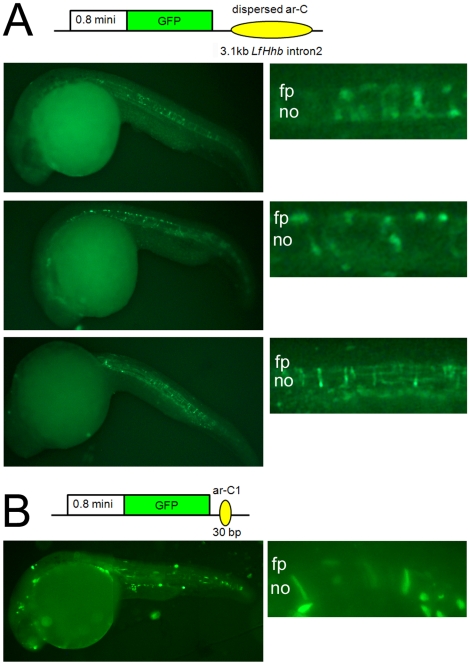
Figure 5. Functional analysis of lamprey CNEs in zebrafish embryos.
A, LfHhb intron2 enhancer activity visualized in representative zebrafish embryos at 26hpf, at low (left) and high magnification (right) focusing on the notochord and floor plate. B, LfHhb ar-C1 enhancer activity visualized in two representative embryo at 26hpf, one at low (left) and one at high magnification (right) focusing on the notochord and floor plate. A schematic representation of the reporter constructs is shown in each case. It contains a zebrafish shha -0.8 kb minimal promoter driving GFP expression under control of the 3.1 kb intron2 (shown in A) or the 30 bp LfHhb ar-C1 (shown in B).

