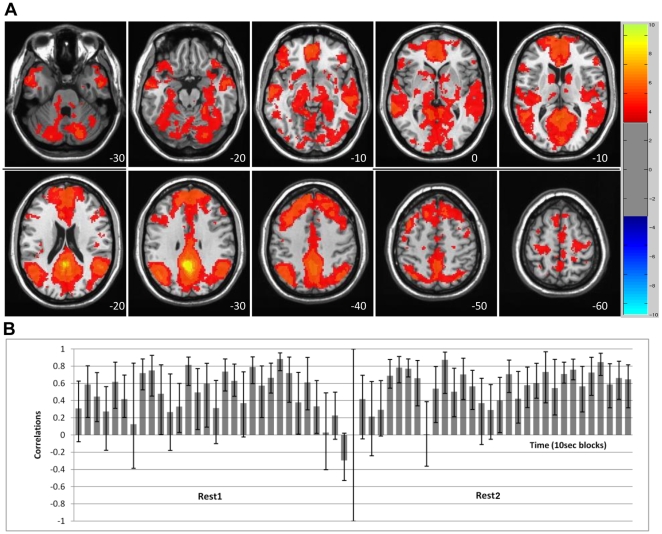
Figure 1. LV1 – the primary DN dynamic showing stable correlations.
LV1 - The primary resting-state spatiotemporal pattern of PCC correlations, showing positive FC across most of the ‘blocks’ in both resting runs. A) The spatial composition, capturing the DN. The red regions (with positive BSRs) indicate areas with positive correlation with the PCC seed (no negative BSRs met the threshold, value range displayed is consistent with Figure 2). B) The temporal structure – correlations of brain scores with seed activity across time for each 10 sec ‘block’. Bars = 95% confidence intervals. The spatial and temporal correlational patterns are very similar across Rest1 and Rest2.

