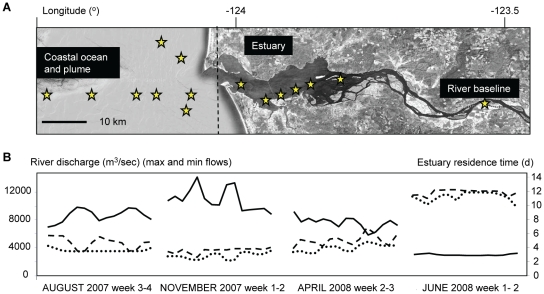
Figure 1. Characterization of the Columbia River coastal margin.
(A) Sampling locations (indicated as stars) along the CRCM transects. (B) Columbia River daily water discharge (dashed and dotted lines indicate minimum and maximum values, respectively), and estuary residence times (solid line), calculated based on U.S. Geologic Survey's National Stream Water Quality Network data collected at Bonneville Dam. Residence times are defined as R = V/(86400*Q), where R is the residence time in days, V is the volume of the estuary in m3 relative to mean sea level (defined from Beaver Army to the mouth), and Q is the river discharge in m3s−1. The data correspond to the 2-week long sample collection times for each month.

